What You Will Learn
- The fundamental principles behind supply and demand trading
- How to identify fresh supply and demand zones on any chart
- Why institutional orders create tradeable zones
- Practical rules for entering and exiting trades
Chapter 1: Understanding the Foundation of Price Movement
Every financial market, whether it is stocks, forex, commodities, or cryptocurrencies, operates on one fundamental principle: the interaction between buyers and sellers. This interaction creates what we call supply and demand. Understanding this concept is not just academic knowledge - it is the foundation upon which professional traders build their entire trading methodology.
Unlike traditional support and resistance levels that most retail traders use, supply and demand zones represent areas where significant institutional orders were placed. These are not random price levels; they are specific zones where banks, hedge funds, and large financial institutions executed massive orders that moved the market.
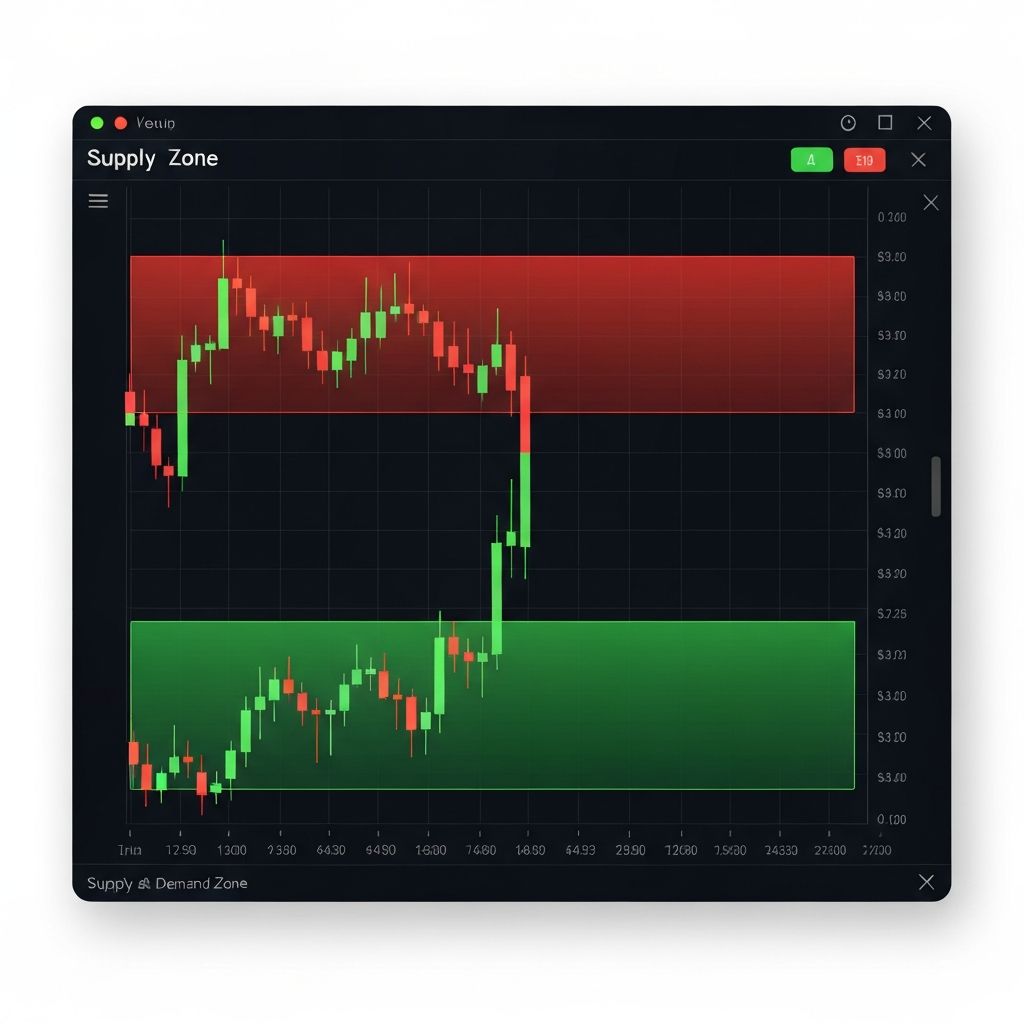
Key Concept: Supply vs Demand
An area where selling pressure exceeds buying pressure. Price dropped sharply from this zone, indicating large sell orders were placed here. When price returns, sellers are likely waiting again.
An area where buying pressure exceeds selling pressure. Price rallied sharply from this zone, indicating large buy orders were placed here. When price returns, buyers are likely waiting again.
Why Traditional Support and Resistance Falls Short
Most traders are taught to draw horizontal lines at previous highs and lows and call them support and resistance. While this approach has some merit, it fundamentally misses the point of what actually moves markets. A single line cannot capture the complexity of institutional order flow.
Consider this: when a major bank wants to buy 100 million dollars worth of EUR/USD, they cannot simply place one order. The market would move against them immediately. Instead, they break their order into smaller pieces and execute them over a price range. This range becomes a demand zone - an area, not a line.
Common Mistake to Avoid
Do not confuse supply and demand zones with simple support and resistance lines. Zones are areas of price consolidation before a strong move, not just previous highs or lows. The quality of the move away from the zone determines its strength.
Chapter 2: The Anatomy of a Perfect Supply Zone
A supply zone is formed when price consolidates (moves sideways) and then drops sharply. The consolidation area represents the zone where institutional selling took place. The sharp drop confirms that sellers overwhelmed buyers. When price returns to this zone, there is a high probability that unfilled sell orders are still waiting.
The Three Essential Components of a Supply Zone
The Rally (Approach)
Price must approach the zone from below. This rally brings buyers into the market who will become trapped when price reverses. The stronger the rally into the zone, the more buyers are trapped, and the stronger the subsequent reversal.
The Base (Consolidation)
This is the actual supply zone - a period of sideways price action where institutions are accumulating their short positions. The tighter the consolidation (fewer candles, smaller range), the stronger the zone. This indicates decisive institutional action.
The Drop (Departure)
Price must drop sharply from the zone. This confirms that selling pressure overwhelmed buying pressure. The faster and stronger the drop, the more imbalance exists between supply and demand, and the higher the probability of a reaction when price returns.
Chapter 3: The Anatomy of a Perfect Demand Zone
A demand zone mirrors the supply zone structure but in reverse. It forms when price consolidates and then rallies sharply. The consolidation area represents institutional buying, and the sharp rally confirms buyer dominance. Understanding this symmetry helps you apply the same analytical framework to both bullish and bearish scenarios.
The Three Essential Components of a Demand Zone
The Drop (Approach)
Price must approach the zone from above. This decline brings sellers into the market who will become trapped when price reverses upward. The stronger the drop into the zone, the more sellers are trapped, creating fuel for the reversal.
The Base (Consolidation)
This is the actual demand zone - a period of sideways movement where institutions accumulate long positions. Look for tight consolidation with small-bodied candles. The fewer candles in the base, the more decisive the institutional action and the stronger the zone.
The Rally (Departure)
Price must rally sharply from the zone. This confirms that buying pressure overwhelmed selling pressure. Look for large bullish candles with little to no upper wicks - this shows strong, decisive buying with no hesitation.
Chapter 4: Practical Rules for Zone Identification
Theory is important, but what separates profitable traders from the rest is their ability to apply concepts consistently in real market conditions. Here are the practical rules that professional supply and demand traders follow religiously.
The 7 Golden Rules of Zone Identification
Fresh Zones Are Best
A zone that has never been tested has the highest probability of causing a reaction. Each time a zone is tested, unfilled orders get filled, weakening the zone.
Strong Departure Equals Strong Zone
The speed and strength of price leaving a zone indicates the imbalance between supply and demand. Explosive moves create the best zones.
Tight Bases Are Superior
Zones with 1-3 candles in the base are stronger than zones with extended consolidation. Tight bases indicate decisive institutional action.
Higher Timeframes Dominate
A zone on the daily chart is more significant than one on the 1-hour chart. Always check higher timeframe zones before taking trades on lower timeframes.
The Drop-Base-Rally Pattern
For demand zones, look for a drop into the zone, a base (consolidation), then a rally away. The reverse applies for supply zones (Rally-Base-Drop).
Zone Proximity Matters
Trade zones that price has traveled a significant distance to reach. A zone that is nearby has likely been partially filled already.
Trend Alignment Increases Odds
Demand zones in an uptrend and supply zones in a downtrend have higher success rates. Trading against the trend requires exceptional zone quality.
Chapter 5: How to Draw Zones Correctly
One of the most common mistakes traders make is drawing zones incorrectly. A poorly drawn zone leads to bad entries, premature stop-outs, and missed opportunities. Here is the exact process professional traders use to draw accurate zones.
Step-by-Step Zone Drawing Process
Step 1: Identify the Explosive Move
Scan your chart for strong, impulsive price movements. These are characterized by large candles with small wicks moving in one direction. The origin of this move is where your zone begins.
Pro Tip:
Look for candles that are at least 2x the average candle size. These indicate institutional participation, not retail noise.
Step 2: Find the Base Candles
Locate the consolidation candles just before the explosive move. These are typically small-bodied candles, dojis, or spinning tops. The base usually consists of 1-5 candles.
Pro Tip:
If you cannot find clear base candles, the zone may not be valid. Strong zones always have a visible consolidation before the move.
Step 3: Mark the Zone Boundaries
For a demand zone, draw a rectangle from the lowest low of the base candles to the highest high (or the open of the first bullish departure candle). For supply zones, do the reverse - from the highest high to the lowest low of the base.
Pro Tip:
Some traders prefer using the body of candles (open/close) rather than wicks for tighter zones. Test both approaches and see which works better for your trading style.
Step 4: Extend the Zone Forward
Extend your zone rectangle to the right so you can see when price returns to it. The zone remains valid until price passes completely through it (all unfilled orders get filled).
Pro Tip:
Use different colors for supply (red) and demand (green) zones. This makes it instantly clear what type of trade setup you are looking at.
Chapter 6: Entry and Exit Strategies
Knowing where zones are is only half the battle. You need clear rules for when to enter trades and where to place your stops and targets. Here are the professional approaches to trading supply and demand zones.
Entry Methods
Aggressive Entry
Place a limit order at the edge of the zone (top of demand, bottom of supply). This gives the best risk-reward but may result in missed trades if price does not reach your order.
- Best risk-reward ratio
- No screen time required
- May miss some trades
Confirmation Entry
Wait for price to enter the zone and show signs of rejection (engulfing candle, pin bar, etc.) before entering. This confirms the zone is holding but reduces risk-reward.
- Higher win rate
- Visual confirmation
- Requires screen time
Stop Loss Placement
Your stop loss should always be placed beyond the zone. For demand zones, place your stop below the lowest point of the zone. For supply zones, place it above the highest point. Add a small buffer (5-10 pips in forex, or ATR-based for stocks) to avoid getting stopped out by wicks.
Critical Rule
Never move your stop loss further away from your entry to avoid a loss. If price breaks through your zone, accept that the zone has failed and move on. Zones fail - it is part of the game. Your edge comes from the zones that work, not from hoping failed zones will recover.
Target Placement
The most logical targets are opposing zones. If you are buying at a demand zone, target the next supply zone above. This makes sense because that supply zone is where selling pressure is likely to appear. You can also use previous swing highs/lows or fixed risk-reward ratios (2:1 or 3:1).
Chapter 7: Common Mistakes and How to Avoid Them
Even traders who understand supply and demand theory often make costly mistakes in execution. Here are the most common pitfalls and how to avoid them.
Mistake 1: Trading Every Zone
Not all zones are created equal. Trading every zone you see will drain your account. Be selective - only trade the highest quality zones with strong departures, tight bases, and trend alignment.
Mistake 2: Ignoring Higher Timeframes
A beautiful demand zone on the 15-minute chart means nothing if price is heading into a daily supply zone. Always check higher timeframes first. Your trade should align with at least the next higher timeframe.
Mistake 3: Trading Zones That Have Been Tested
Each time price returns to a zone, some of the unfilled orders get filled. After 2-3 tests, most zones are exhausted. Focus on fresh, untested zones for the highest probability setups.
Mistake 4: Drawing Zones Too Wide
Wide zones lead to poor risk-reward ratios and unclear entries. Focus on the tight consolidation area, not the entire price range. If your zone spans more than 3-5 candles, you are probably drawing it wrong.
Mistake 5: Not Having a Trading Plan
Knowing about supply and demand is not enough. You need a complete trading plan that specifies which zones you will trade, how you will enter, where your stop goes, and what your target is - before you place any trade.
Conclusion: Your Path to Supply and Demand Mastery
Supply and demand trading is not a magic formula that guarantees profits. It is a framework for understanding market structure and identifying areas where institutional money has left its footprint. Like any skill, it requires practice, patience, and continuous refinement.
Start by practicing zone identification on historical charts. Mark zones and see how price reacted when it returned. Track your accuracy and look for patterns in the zones that work versus those that fail. Over time, you will develop an intuition for high-quality zones.
Remember: the goal is not to catch every move in the market. The goal is to identify high-probability setups where the risk-reward ratio is in your favor and execute them consistently. Master the fundamentals covered in this guide, and you will have a solid foundation for profitable trading.
Ready to Identify Supply & Demand Zones Automatically?
Drawing zones manually takes time and is prone to human error. ChartLab-IQ uses advanced AI to identify high-quality supply and demand zones in seconds, so you can focus on what matters - making profitable trading decisions.
Try ChartLab-IQ Free